Privacy-friendly usage analytics and monitoring

Hello!
In my previous posts, I covered the technology stack behind Secutils.dev and how I deploy its components to a Kubernetes micro-cluster. Today, I want to walk through the tools I use to monitor that deployment and to collect privacy-friendly product analytics.
The shape of the analytics and monitoring setup has held up well. Two things have evolved:
- The Rust API switched from
log+env_loggerto thetracingcrate for structured, span-aware logs that ingest cleanly into Elasticsearch. - The notifications subsystem also writes a
[Notification]log record per delivery, which feeds custom Kibana visualisations covered in "Q3 2023 update - Notifications".
Usage analytics: Plausible
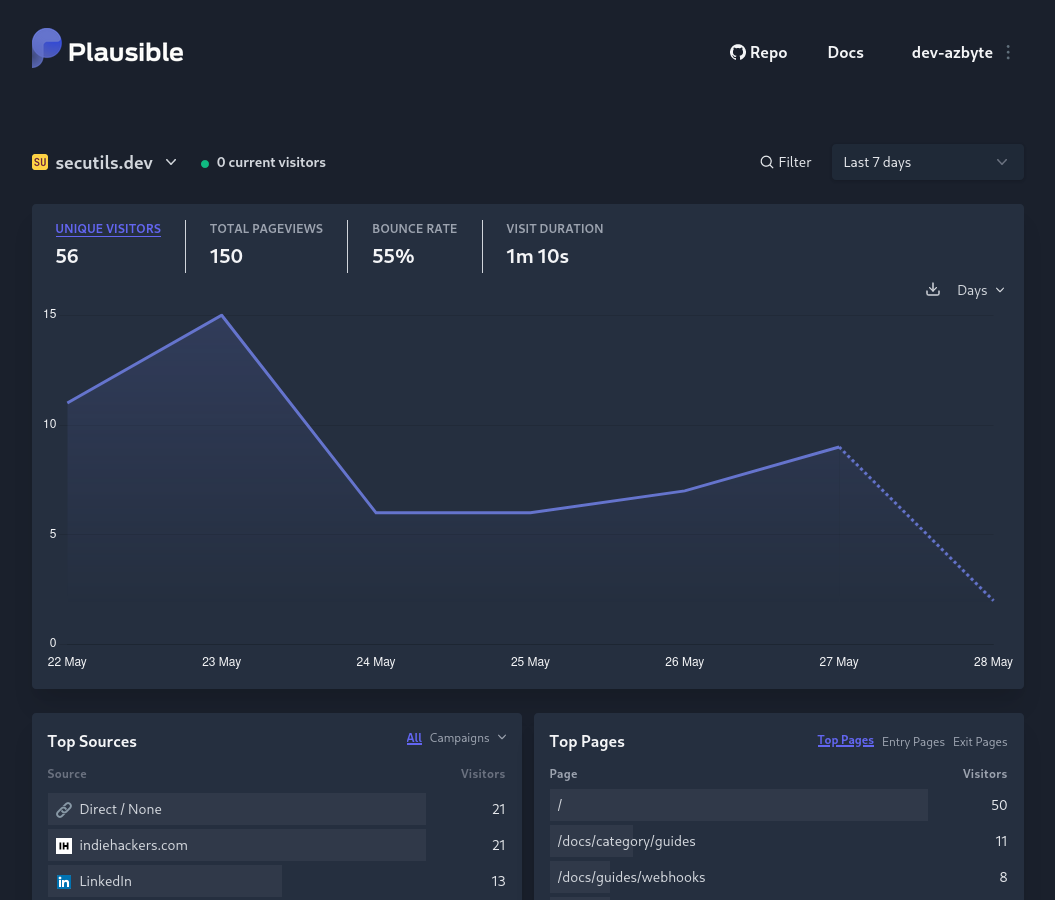
Knowing your users, where they come from, and how they use your product is critical, especially in the early days. Google Analytics is the obvious default, but its privacy reputation makes it a hard sell for a security-focused tool. Building and maintaining user trust is a top priority for Secutils.dev, so I went with Plausible Analytics instead: it's open-source, privacy-friendly, GDPR/CCPA/PECR compliant, and the script is around 1 KB.
Long-term I'd happily pay for Plausible's managed offering to support the team, but pre-revenue every euro counts, so today I run the self-hosted version on the same Kubernetes cluster as the rest of Secutils.dev. The Plausible app is three pieces: a PostgreSQL database, a ClickHouse database, and the Plausible web server. Their Kubernetes manifests make this very straightforward to deploy.
One small trick worth mentioning: Plausible's script is renamed to avoid being blocked by ad-blockers. Privacy-friendly analytics shouldn't be lumped in with surveillance ad tech, and routing the script through a first-party endpoint keeps the data accurate without compromising anyone's privacy. A dedicated Traefik rule handles the rewrite:
apiVersion: traefik.io/v1alpha1
kind: IngressRoute
spec:
  routes:
    - kind: Rule
      match: Host(`secutils.dev`) && Path(`/js/script.js`)
      services:
        - kind: Service
          name: plausible
          port: 8000
Here's what the Plausible dashboard looks like for Secutils.dev:
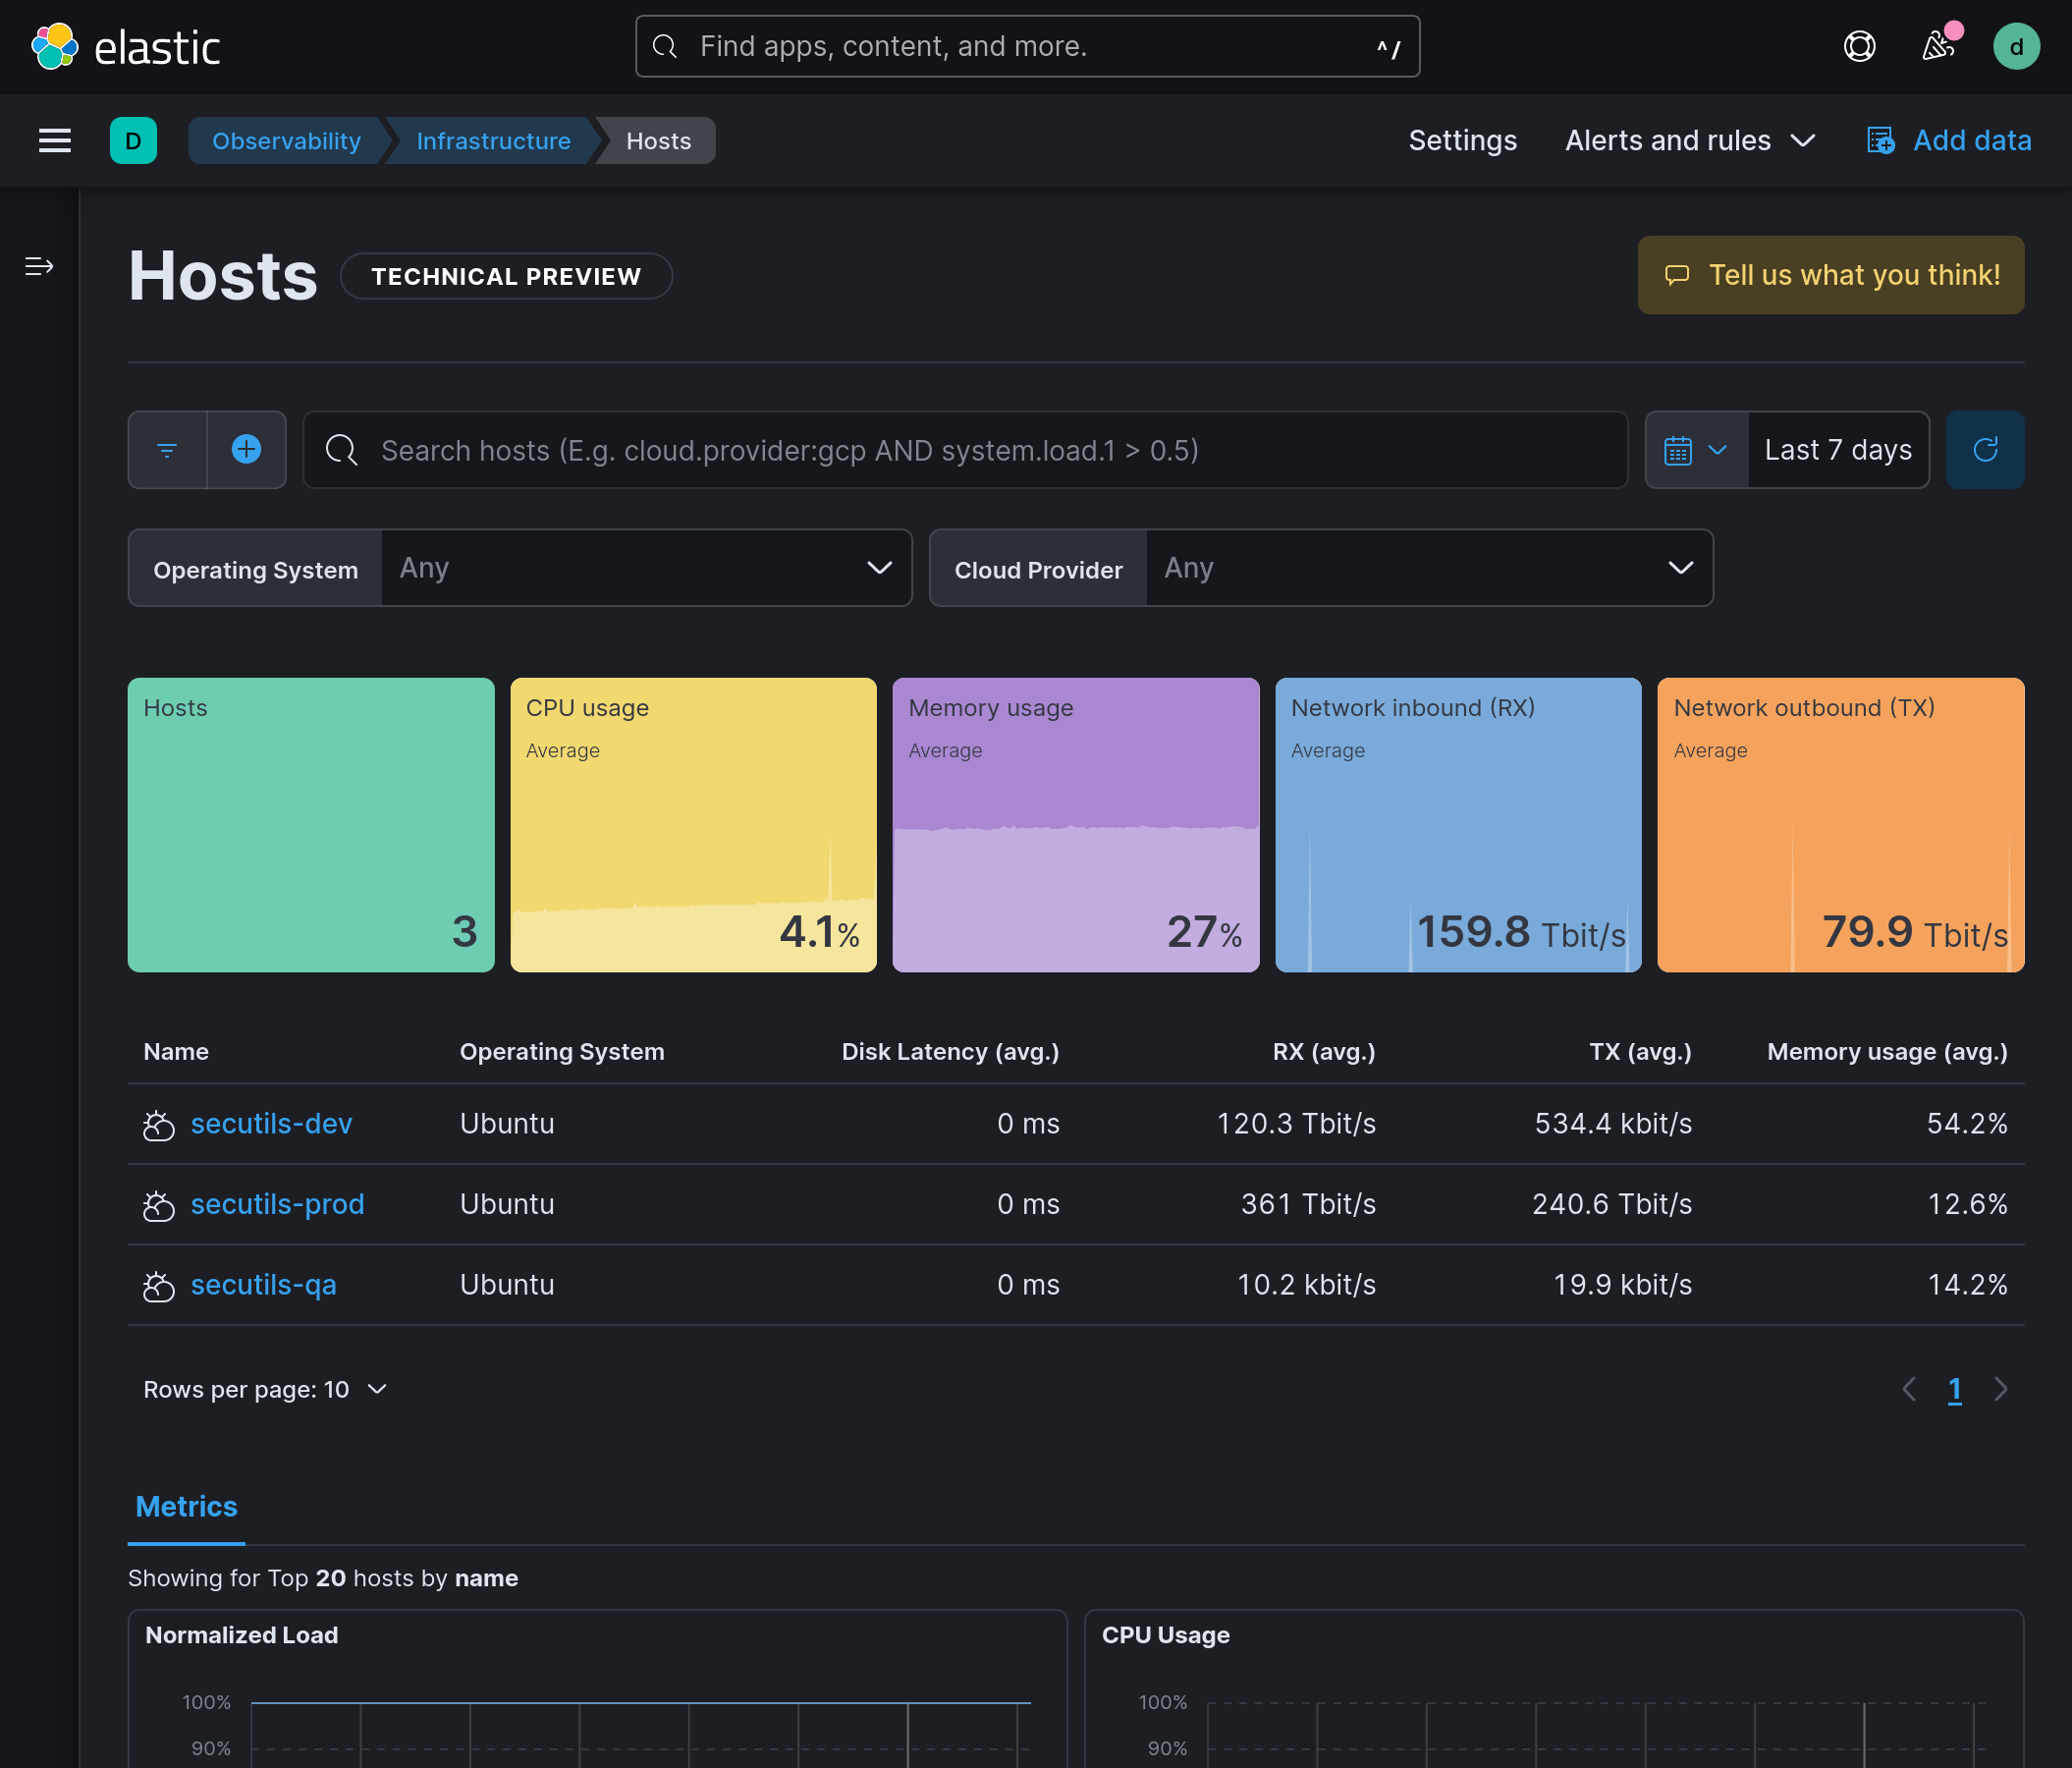
Operational monitoring: the Elastic Stack
I work for Elastic, so the choice of monitoring stack was something of a no-brainer: I know Elasticsearch and Kibana inside out and they handle log + metric workloads excellently for any indie-scale project.
Elastic Cloud on Kubernetes (ECK) provides production-grade Kubernetes manifests for the whole stack, which means I can self-host the entire monitoring infrastructure for free under the Elastic Basic license. The pieces I deploy are:
- Elasticsearch - the storage and search engine for logs and metrics.
- Filebeat - collects pod logs and ships them to Elasticsearch.
- Metricbeat - collects host and container metrics (CPU, memory, network).
- Kibana - dashboards, ad-hoc exploration, alerting.
Structured logs from the Rust API
The Secutils.dev API now uses the tracing crate, which emits structured JSON records that Elasticsearch can index without any pre-processing. Spans add per-request context (user ID, route, latency) and link related events into a single trace, which makes incident investigations far less painful than line-by-line greps.
The notifications subsystem also writes a synthetic [Notification] log record per delivery. A small Kibana dashboard slices these by destination, type, and outcome, giving me a per-feature signal without any extra metric pipeline.
What I'd add next
I'm still using only the basics of the Elastic Stack. The two natural next steps:
- Elastic APM to trace requests across the API, Retrack API, and Web Scraper, with distributed traces visible in Kibana.
- Elastic Machine Learning to flag anomalous user behaviour (e.g. tracker spam, brute force on the Kratos endpoints).
Neither is mandatory at the current scale, but both are essentially zero-cost upgrades inside the Basic license tier.
Frequently asked questions
Why self-host Plausible instead of using Google Analytics?
Privacy and trust. Plausible is GDPR/CCPA/PECR compliant out of the box, the script is tiny, and it gives a security-focused product the right signals (referrers, pages, conversions) without using cookies or personal identifiers.
Why the Elastic Stack instead of Datadog/New Relic?
Familiarity, price (the Basic license is free for self-hosters), and the data model (every log line is a queryable JSON document, which is exactly what tracing produces). Datadog and New Relic are both great products, I just don't need a SaaS bill at this scale.
How do you keep storage from filling up?
Index lifecycle management policies in Elasticsearch (rollovers + deletes after a fixed retention window) keep both logs and metrics indices bounded. The same pattern works for Plausible's ClickHouse store, but ClickHouse compresses analytics events extremely well, so this hasn't been a concern in practice.
That wraps up today's post, thanks for taking the time to read it!
If you found this post helpful or interesting, please consider showing your support by starring secutils-dev/secutils GitHub repository. Also, feel free to follow me on Twitter, Mastodon, LinkedIn, Indie Hackers, or Dev Community.
Thank you for being a part of the community!